
If you're learning to code in Finland in 2026, the advice you get is mostly wrong for where you live. Stack Overflow surveys and TIOBE rankings measure the global market. Bootcamp curricula were written 18 months ago. LinkedIn shows 300+ applicants on every job posting with no way to tell how many are actually qualified. Peers in your Slack channel each swear by a different stack.
Meanwhile the Finnish tech market has its own strange shape. Azure dominates hiring in a way nobody warns you about. Finnish language requirements lock large parts of the public sector out of reach for internationals. Some skills that look red-hot globally are genuinely unused here. The gap between "what the internet says to learn" and "what gets you hired in Helsinki" can be months of wasted study.
I wanted to close that gap with data instead of opinions.
Problem & Opportunity
Through customer development interviews with bootcamp students, self-taught switchers, and recent immigrants trying to break into Finnish tech, one pain kept surfacing in different shapes:
"I'm investing months of my life and most of my savings into learning this stack — and I have no way to check whether local employers actually want it."
The people feeling this most acutely are in their late 20s to mid 40s, often mid-career switchers with dependents and a finite financial runway. They're research-driven, comfortable with data, and deeply skeptical of generic career advice. They don't need a coach. They need a window into the market that updates faster than a bootcamp curriculum and reflects their actual city.
Nothing on the market did that for Finland specifically. Global tools aggregate at the wrong level. Finnish job boards list postings but don't aggregate skills. Recruiters have the data internally but don't publish it. That's the gap.
Solution
Statistically Employable is a single-page tool built around one primary view: a ranked chart of the most in-demand tech skills in a Finnish city, powered by real job postings from that week. From there users can:
- Switch between Helsinki, Tampere, Turku, and Oulu
- Filter by "All levels" or "Junior / Entry-level"
- Tap a skill to see how demand has trended over the last 8 weeks
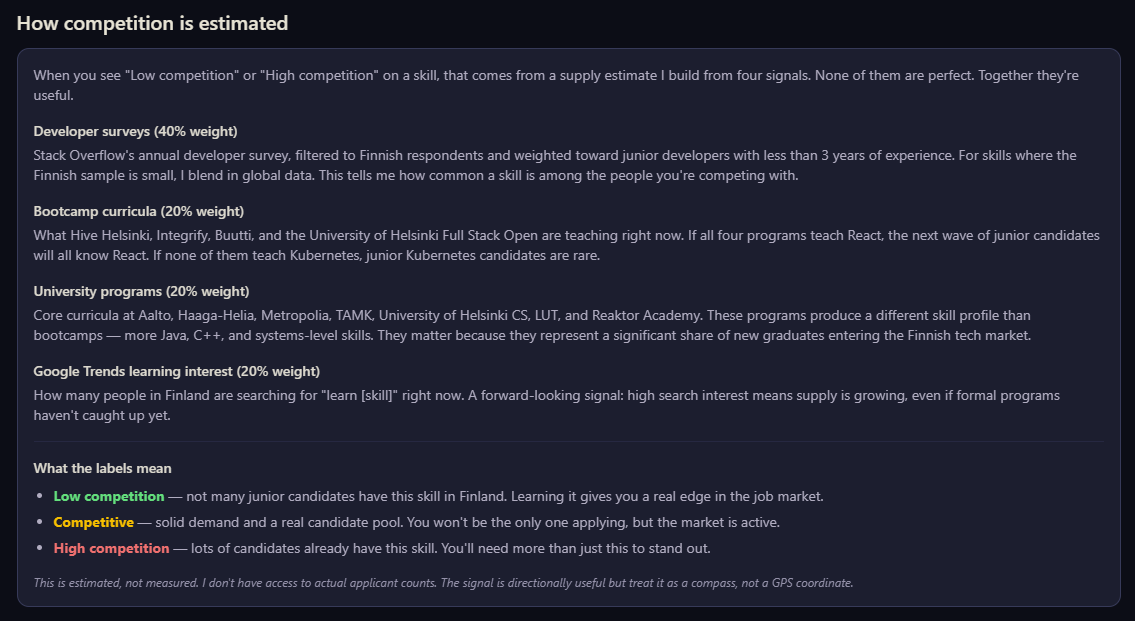
- See a competition indicator estimating how saturated the candidate side is
Under the hood, a weekly pipeline scrapes Finnish job boards, extracts skill mentions against a hand-curated canonical skill list, normalizes variants (ReactJS, React.js, React all collapse into one), detects experience level heuristically, and aggregates everything into Supabase. The frontend is Next.js on Vercel, rendering server-side by default so the first view is instant.
The design principle throughout: show, don't advise. The product is a window into the market, not a career coach. Users draw their own conclusions — the data just makes them visible.
Target Audience
The primary user is what I've been calling the Anxious Career Switcher: a 28-to-45-year-old transitioning into tech in Finland, often through a bootcamp like Hive or Integrify, often an immigrant navigating an unfamiliar job market, usually with a mortgage or family in the background and a finite buffer of savings.
They have high uncertainty and low patience for fluff. They want a direct signal on what to learn next, and they want it without a signup flow, a paywall, or a 20-minute onboarding tour. The design targets them specifically — everything else is secondary.

"This deserves way more attention. I like to analyze job ad data for fun too. Lots of information in there." — Reddit commenter, soft launch weekend
Team & My Role
Statistically Employable is a solo project. I'm the founder, PM, designer, engineer, writer, and customer researcher. In practice that breaks down into:
- Product strategy and prioritization. Running the experiment portfolio, writing PRDs, and deciding what ships. I use a Radical Product Thinking-style vision/survival matrix to keep the experiments honest about what's advancing the mission versus what's chasing novelty.
- Customer development. Interviewing bootcamp students and career switchers, extracting patterns into a living persona document, and feeding the findings back into every PRD.
- Full-stack engineering. Building the whole thing — scraping pipeline, normalization logic, Supabase schema and RLS, Next.js app, component library — with AI-assisted development so I can ship new experiments in days.
- Brand and voice. Writing every line of copy in the product's voice (a dry, self-aware entity that finds the Finnish tech hiring market both interesting and slightly absurd), plus data-driven blog posts that feed SEO.
- Growth and distribution. Running the soft launch, publishing SEO content, and talking directly to users on Reddit and LinkedIn to gather feedback on what's working and what isn't.
The upside of doing all of this alone is speed — a new experiment can go from hypothesis to shipped in a week. The downside is that every trade-off is mine to make, and there's nobody to tell me when a good idea is a bad idea.
Results & Impact
The soft launch in March 2026 pulled about 1,000 sessions from a single LinkedIn post and a single Reddit post. The most interesting numbers from that first weekend:
- 28.4% of sessions had meaningful interactions. Above the 40% target for filter or city changes was a stretch, but nearly a third of visitors actively poking at the data validated that the core view wasn't purely passive.
- 119 experience-level filter changes. People weren't just scrolling — they were actively personalizing, which is exactly the behavior the persona predicted.
- 14 skill suggestions submitted in two days. Users wanted the dataset to grow, which is a far better signal than silence.
- 26% bounce rate, 1m 44s average session. People stayed.
- 99–100 speed scores on desktop and mobile. Not a vanity metric — this audience is on the move, often on phones, and the product had to feel instant.
More importantly, the qualitative feedback on LinkedIn and Reddit validated the core hypothesis: nobody questioned whether local skill demand data was useful. Every piece of critical feedback was "I want more depth" — show me the underlying jobs, personalize the view, expand the skill list — not "I don't need this."
Some of the strongest feedback came from unexpected places. Commenters pointed out that Azure's dominance in Finnish hiring was news to them too, and the resulting thread turned into an impromptu discussion about why the bootcamp curricula haven't caught up. That's the kind of market conversation the tool was built to spark.
The product is free, early, and still actively being shaped by what users tell me. The next experiments focus on closing the biggest gap that came out of the launch: "what does this mean for me?" — turning raw skill counts into something users can see themselves in.
Learnings
The shortest path to signal is shipping something embarrassing. I spent a lot of time beforehand trying to decide which features were "enough" to launch with. In hindsight, the first 1,000 users taught me more about what was missing than any amount of internal planning would have. The critical feedback that mattered most ("competition labels are confusing," "skill list is too small," "I want to see the actual jobs") only became visible once real people were clicking real things.
Doing it alone is fast until it's lonely. Solo development with AI assistance is genuinely new and genuinely powerful — I can ship an experiment in the time it used to take to write the PRD. But the trade-off is that every decision is mine to second-guess, and there's no team debate to pressure-test ideas. I've had to build my own rituals (customer interviews, explicit prioritization frameworks, public feedback loops) to replace the conversations I'd normally have with teammates.
Personality is a feature, not decoration. The product could have presented as a neutral dashboard. Instead I built it around a specific voice — dry, direct, self-aware, slightly amused at the absurdity of the hiring market. That decision turned out to be one of the strongest draws. Users remember the tone, quote it back, and engage with the data in a way they probably wouldn't with a generic job board. Character compounds; polish doesn't.


No items found.
Check Out My Other Projects

Berry | An Always-On Bilingual AI News Assistant
A Raspberry Pi that wakes up before my wife and I, researches the day's AI and tech news, and delivers a personalized morning brief to each of us over Telegram - in Japanese and English, tailored to what the two of us care about.
View Case Study

App of Empires | Design of a Web App
A "virtual coach" for players of the 20-year old classic RTS, Age of Empires 2, for improving gameplay.
View Case Study

